Guides 11 Mar 2026
How to Route Docker Alerts to Slack with AI Analysis
This deep dive walks through a concrete secnario: A Docker-related alert is forwarded by Alertmanager to Admin Companion Gateway, routed into a restricted ac-ops use-case, and returned as a Slack notification with first analysis and recommended action.
 ayonik engineering

Example workflow: A Docker alert, forwarded through Admin Companion Gateway, analyzed in a restricted ac-ops use case, and forwarded to Slack with recommended next steps.
In our previous post, we introduced the broader shift in Admin Companion: from interactive co-administration alone to a platform that now also supports guard-railed automation and event-driven workflows.
This article takes a closer look at one concrete path through that expanded model:
Docker alert → Prometheus Alertmanager → Admin Companion Gateway → ac-ops → Slack
The goal is not just to forward an alert. The goal is to turn a raw event into something more useful for operations: a notification with first analysis, likely cause, and recommended action.
The scenario at a glance
The sample flow starts with a Docker-related monitoring alert. Alertmanager sends the event to Admin Companion Gateway over HTTP. Gateway selects a profile, derives the target host and use-case, and invokes ac-ops remotely on the target host in restricted mode.
ac-ops then analyzes the situation within the boundaries of the selected use-case and allowed tools. The result is sent via Admin Companion Gateway to Slack as a structured notification that includes more than the original alert: it includes first analysis and recommended next steps.
That is the practical idea behind the Gateway and `ac-ops` combination: event-driven intake on one side, policy-enforced execution on the other.
Step 1: the incoming event from Alertmanager
The starting point is a standard Alertmanager webhook event. For this scenario, the important fields are not the entire payload, but the parts that drive routing and analysis:
commonLabels.alertnamecommonLabels.instancecommonAnnotations.summarycommonAnnotations.description
A simplified view of the sample event looks like this:
{
 "receiver": "acops-gateway",
 "status": "firing",
 "commonLabels": {
 "alertname": "AcopsDemoContainerMissing",
 "instance": "10.0.0.4:8080",
 "severity": "critical"
 },
 "commonAnnotations": {
 "description": "Container stopped/vanished (no cadvisor update for > 15s).",
 "summary": "acops demo container missing on 10.0.0.4:8080"
 }
}
Two fields matter immediately:
instancetells Gateway which target host this event belongs toalertnamehelps determine whichac-opsuse-case should run
This is an important boundary in the design: Alertmanager sends the event as it normally would. The interpretation and mapping happen in Gateway.
Step 2: profile-based mapping in Admin Companion Gateway
Gateway does not hardcode event handling logic. Instead, it uses profiles.
In this scenario, the HTTP endpoint /v1/alertmanager-ticket is mapped to the profile alertmanager-ticket. That profile defines how to extract the target host, how to select a use-case, what to pass into ac-ops, and where the result should go.
The most relevant parts of the profile are these:
endpoints:
 - path: /v1/alertmanager-ticket
 profile: alertmanager-ticket
profiles:
 alertmanager-ticket:
 target_host:
 coalesce:
 - path: commonLabels.instance
 - path: "alerts[0].labels.instance"
 transforms: [trim, lower, strip_port]
use_case:
 map:
 key:
 coalesce:
 - path: commonLabels.alertname
 - path: commonLabels.service
 - path: commonLabels.job
 transforms: [trim, lower]
 table:
 acopsdemocontainermissing: docker-issue-analysis.yaml
 acopstargetdown: docker-issue-analysis.yaml
 default: "docker-issue-analysis.yaml"
 transforms: [trim]
stdin_payload:
 json_dump:
 path: $
output:
 return_result: false
 http_error_on_ac_ops_failure: true
 sinks:
 - type: webhook
 method: POST
 url:
https://hooks.slack.com/services/***/***/***
body: |
{"text":"New Ticket: ${json_escape:in.commonLabels.alertname} on ${json_escape:ctx.target_host}\n${json_escape:ctx.ac_ops_output}"}
This one profile already shows why Gateway is more than a transport wrapper.
It does four important things:
1. It derives the target host
The profile reads commonLabels.instance and strips the port, so 10.0.0.4:8080 becomes 10.0.0.4.
2. It selects the ac-ops use-case
The profile maps AcopsDemoContainerMissing to docker-issue-analysis.yaml.
3. It forwards the full event as input
The full incoming JSON is passed to ac-ops via stdin.
4. It defines the downstream sink
In this sample, the sink is a Slack Incoming Webhook that receives the resulting analysis.
This is the key design point: The workflow is configured, not glued together in custom code.
Step 3: restricted remote execution through ac-ops
Once the profile has selected the target host and use-case, Gateway invokes ac-ops remotely.
In our scenario, that means:
- connecting to the target host via SSH
- using restricted execution mode
- passing the selected use-case
- passing the event payload via stdin
The point of this step is not just automation. It is bounded automation.
Gateway does not send the event to an unrestricted agent. It triggers a specific ac-ops use-case on a specific target host under explicit policy constraints.
That is where the guard rails matter.
Step 4: the ac-ops use-case defines the analysis boundary
The selected use-case in this sample is docker.issue.analyze.v2.
Its instruction is focused and operationally narrow:
id: docker.issue.analyze.v2
description: Analyze a Docker issue from an event payload

instruction: |
 Analyze the provided Docker event/log snippet.
 By collecting evidence via allowed tools, identify the likely root cause of the issue as well as the proposed steps to fix it.
 Output the results as ticket to an Administrator, which handles the issue then.
The important thing here is not just the instruction text. It is the boundary around that instruction, which exactly defines, which tools may be used by this use case:
tools:
  - name: DockerPs
 run_as: sudo
  - name: DockerInspect
 run_as: sudo
  - name: DockerLogs
 run_as: sudo
  - name: DockerEvents
 run_as: sudo
  - name: SystemctlStatus
 run_as: sudo
  - name: JournalctlUnit
 run_as: sudo
  - name: FileQuery
 run_as: sudo
For example, SystemctlStatus is limited to a small allowlist of relevant units:
tool_config:
 SystemctlStatus:
 restrict:
 unit:
 match: exact
 allow:
 - docker.service
 - containerd.service
That means the workflow cannot inspect arbitrary systemd units. In this use-case, it is limited to the container runtime services that are relevant to the Docker alert being analyzed.
Other tools are restricted in the same way. For example, file access is limited to selected directories such as /var/log and /etc/docker.
That is the operational point of ac-ops: the workflow can use AI-driven reasoning, but the execution surface stays constrained by the use-case and tool restrictions.Step 5: one example tool in practice
To make that more concrete, here is a simplified example from one of the shipped tools, SystemctlStatus.
Its tool definition defines and constains the expected parameters:
description: systemctl status
parameters:
 type: object
 properties:
 unit:
 type: string
 n:
 type: integer
 minimum: 1
 maximum: 500
 full:
 type: boolean
 required:
 - unit
And the shell implementation then builds a bounded systemctl status call rather than allowing arbitrary command execution.
That is relevant because it shows how Admin Companion keeps the workflow useful without falling back to unrestricted shell access.
The model is allowed to choose from defined tools and parameters, not to improvise arbitrary host commands.
Step 6: the resulting Slack notification
The final Slack message is where the value becomes visible.
The original alert said, in effect, that a monitored container had vanished or stopped updating. That is useful, but incomplete. An operator still has to determine what actually happened and what to do next.
The Slack output from this sample run goes further. It includes:
- The affected host and alert
- First analysis
- Concrete evidence
- A likely root cause
- Proposed steps to fix the issue
This is an outcome of a real run with Admin Companion:
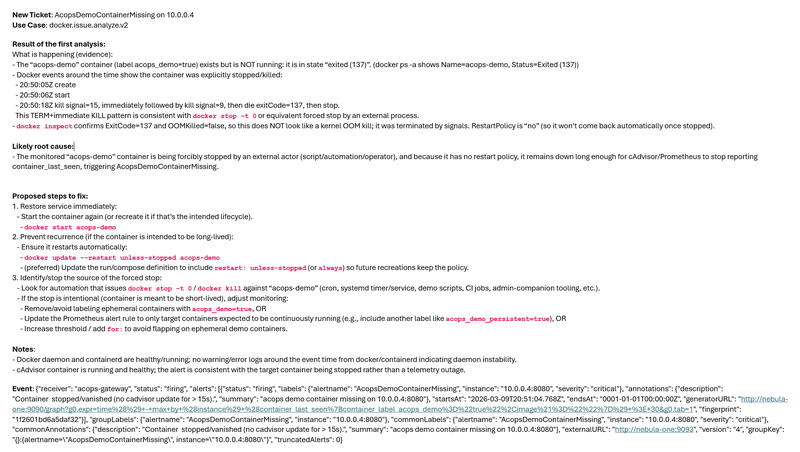
Summary of the result
The issueAcopsDemoContainerMissingon10.0.0.4
What happened
Theacops-democontainer exists, but it is not running. Docker events show that it was explicitly stopped or killed.
Likely root cause
The container appears to have been forcibly stopped by an external actor or automation, and because it has no restart policy, it stayed down long enough to trigger the alert.
Proposed steps to fix
- Start the container again
- Add or update a restart policy if the container is intended to be long-lived.
- Identify the process or automation that stopped it.
- If the stop is intentional, adjust monitoring to avoid false positives.
Along with the proposed steps, the notification also includes concrete commands with concrete parameters for this exact situation.
That is a different operational outcome from plain alert forwarding.
Instead of a raw monitoring signal, the recipient gets a first-pass operational analysis with actionable next steps.
Because Admin Companion is already installed on the target host, the administrator can also continue the investigation interactively with ai, using the Slack result as the starting point for a deeper follow-up analysis.
Why this makes a difference
This sample shows how the Gateway and ac-ops combination changes the role of alerts.
Without this flow, the monitoring system sends a notification and the operator still has to begin the investigation from scratch.
With this flow:
- Alertmanager still sends the original event
- Gateway maps it to the right host and use-case
ac-opsperforms bounded analysis on the target system- Slack receives an enriched result with guidance
This reduces manual triage without turning the environment into an unrestricted AI execution surface.
In practice, that can significantly reduce mean time to resolution (MTTR) and help shorten service-impacting downtime.
Closing thoughts
This scenario from Docker alert to Slack is a small example, but it captures the larger point.
Admin Companion Gateway does not just receive events. It maps them into controlled workflows.
ac-ops does not just automate execution. It constrains that execution through use-cases, allowed tools, and restricted parameters.
And the final result is not just another forwarded alert. It is a notification that already contains first analysis, likely root cause, and recommended action.
That is the practical value of combining event-driven intake with guard-railed automation.
Try for free
Download and install Admin Companion client (ai + ac-ops) and Admin Companion Gateway and try it for free.
More on AI-assisted operations topics

With the 6.x versions, Admin Companion has become more than an interactive shell assistant. It introduced ac-ops for guard-railed automation, and Admin Companion Gateway as a separate package for event-driven workflows. Together this makes Admin Companion a platform for three connected operating modes: interactive co-administration, bounded automation, and alert-driven analysis, notifications, and ticketing.

Admin Companion and the RHEL Lightspeed command-line assistant both bring natural-language help to the terminal, but with different strengths. This article highlights their key differences and when to choose which.

A Linux service fails, an alert fires, and the default reaction is often to restart it immediately. That is frequently the wrong first move. When a service managed by systemd enters a failed state, the first priority is not action but understanding: what failed, when it failed, what changed, and whether a restart is safe or likely to destroy useful evidence. A disciplined first-pass investigation reduces guesswork, avoids unnecessary blast radius, and helps operators distinguish between a service problem, a dependency problem, and a wider host-level issue.